-75%


Related Papers
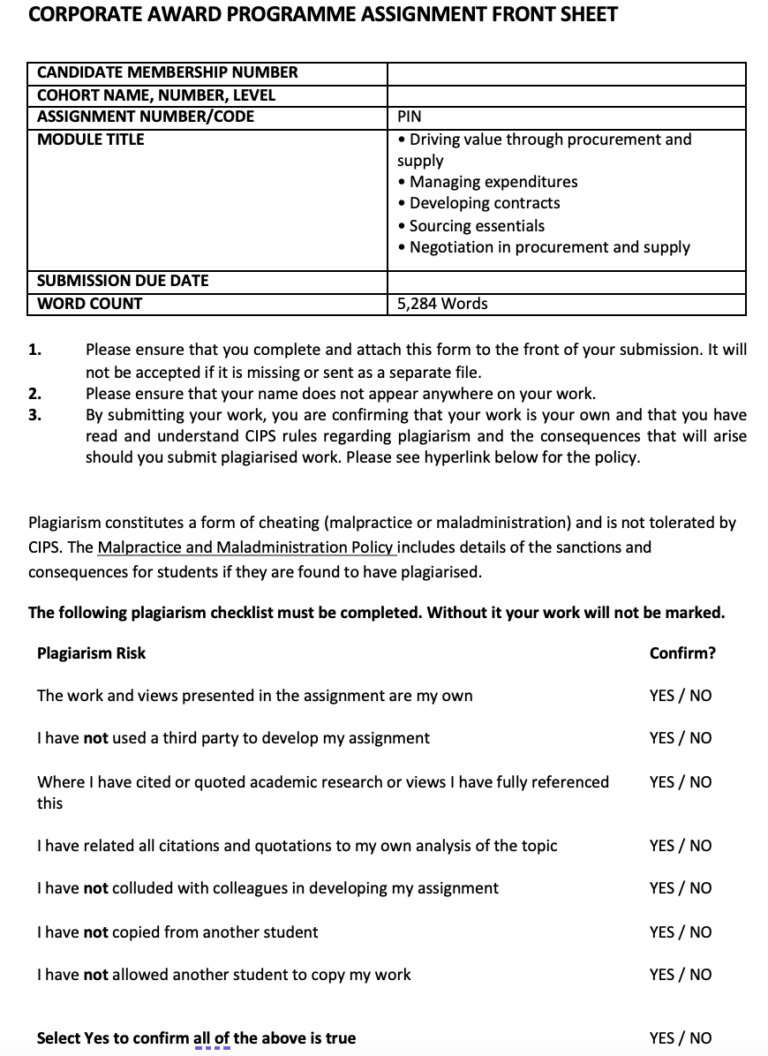
(Solution) CIPS PIN Final Assessment Negotiation in procurement and supply
Original price was: £ 30.00.£ 10.00Current price is: £ 10.00.
- In this integrative assessment for Corporate Award Program establishes it has provided a formal commercial negotiation for Occidental of Oman operating in oil and gas industry.
- Commercial negotiation plan has been developed by reference to data, factual information and CIPS tools. HSE and chemicals portfolio spend category has been identified and evaluated in-depth to come up with an appropriate negotiation plan.
- The importance of identifying the HSE and Chemicals are informed by the previous COVID-19 pandemic which has informed on the need for adopting healthy business environment which is free from any infections.
- Further, coming from the pandemic where the level of business operations had significantly reduced and the organisation need to restart their operations by cleansing their systems and machines. In this case, the need for HSE and the chemicals portfolio in Occidental of Oman has been in an upward trajectory.
- For negotiation successful implementation, Occidental of Oman involves professionals, terms and conditions initiated, holistic readiness and streamlined procurement and supply chain approaches. This is with good forecast and plans being core for guaranteeing customers services delivery on time.
- From the analysis, different tools including SWOT, PESTLE and 4R’s have evidenced that Occidental of Oman is always on the advantage of ensuring they achieve the Best Alternative for Negotiated Agreement (BATNA).
- Also, this report highlight the need for holistic planning by prioritising on all expectation from the initial opening to the closure and agreement phases of negotiation.

(Solution) New CIPD 5C001: Orgnanisational Performance and Culture in Practice
Original price was: £ 70.00.£ 10.00Current price is: £ 10.00.
(Solution) CIPS Occidental of Oman Commercial Management Assessment
Original price was: £ 40.00.£ 10.00Current price is: £ 10.00.
(Solution) MN7648- Managing Human Resources in a Business Context
Original price was: £ 30.00.£ 10.00Current price is: £ 10.00.
(Solution) 5HR03 (AC3.2) Evaluate the most appropriate ways in which benchmarking data can be gathered and measured to develop insight
Original price was: £ 40.00.£ 10.00Current price is: £ 10.00.
(Solution) 5HR02 (AC1.1) Explain how organisations strategically position themselves in competitive labour markets
Original price was: £ 20.00.£ 10.00Current price is: £ 10.00.